Case Study: Property Portfolio Management
A Power BI dashboard designed to provide a comprehensive, 360-degree view of a large-scale residential property portfolio.
Project Type
BI Solution
Tools Used
Power BI, DAX, Star Schema
Sector
Commercial
Properties Analysed
5,500+
Project Overview
This project was undertaken by our founder, Sufyan Iftikhar as an Assistant Data & Reporting Manager. The task was to take raw, disconnected datasets related to a large property portfolio and transform them into a powerful, interactive Power BI dashboard. The goal was to demonstrate proficiency in data modeling, DAX, and creating visually compelling reports that deliver actionable business insights.
The Business Challenge
A property investment firm had its portfolio data spread across multiple CSV files: a master list of all owned properties (Company Stocklist), a list of properties managed by external agents (Agent Stocklist), tenancy agreement details, and a mapping file for agents and locations. This fragmented data structure made it impossible to get a holistic view of the portfolio's performance, leading to several challenges:
- Inability to accurately track key metrics like portfolio-wide occupancy and vacancy rates.
- Difficulty in comparing the performance of different managing agents and regions.
- No straightforward way to analyse rental income against estimated market values (ERV).
- Time-consuming and error-prone manual data consolidation for any ad-hoc analysis.
My Solution: An Integrated Analytics Dashboard
Sufyan developed a comprehensive Power BI dashboard built on a robust and efficient data model. The solution involved two key stages:
1. Data Modeling: The Star Schema
The foundation of the report is a meticulously designed star schema data model. This approach is crucial for performance and scalability in Power BI.
- Fact Table: A central 'Tenancy' table containing the core transactional data like rental amounts and dates.
- Dimension Tables: Separate tables for 'Company Stocklist', 'Agent Stocklist', 'Agent Mapping', and a custom-built 'Date' table.
- Relationships: Clean, single-direction relationships were established from dimension tables to the fact table, ensuring data integrity and query efficiency.
2. Dashboard Development
The front-end is an intuitive and interactive dashboard that allows stakeholders to explore the data effortlessly.
- KPI Cards: High-level metrics like Total Properties, Occupancy Rate, and Average Rent are displayed prominently.
- Visualisations: Charts and maps show the distribution of properties, regional performance, and occupancy status.
- Interactive Filters: Users can dynamically filter the entire report by region, managing agent, property type, number of bedrooms, and more.
Dashboard Preview
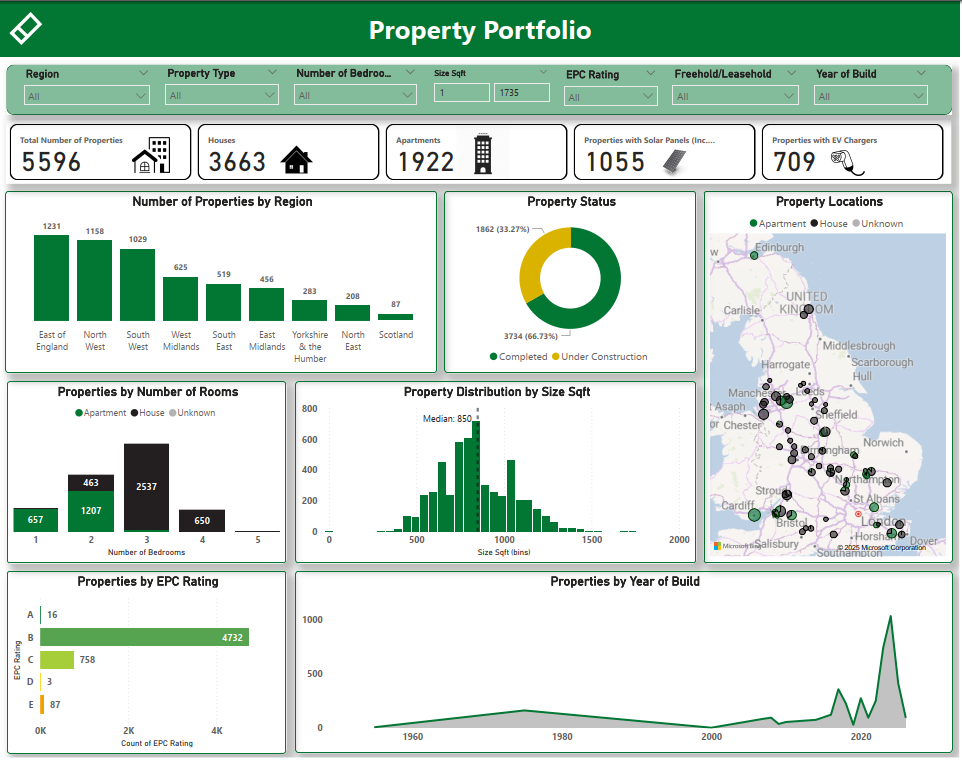
Key Features & Actionable Insights
- Portfolio Health Overview: Provides an immediate, high-level summary of the entire portfolio's status and performance.
- Occupancy & Vacancy Analysis: Users can instantly see which regions or agents have the highest vacancy rates, enabling targeted intervention.
- Rental Performance Comparison: The dashboard clearly visualises the gap between the current Estimated Rental Value (ERV) and the actual achieved rent, highlighting opportunities for rent reviews.
- Geospatial Analysis: An integrated map shows property distribution across the UK, helping to identify regional concentrations and potential new investment areas.
- Compliance Monitoring: Key dates for compliance checks (e.g., Gas Certificate Expiry) are tracked to ensure regulatory adherence.
Have a challenge for us?
Let's discuss how our expertise can be applied to solve your organisation's unique data and AI challenges. Schedule a complimentary call today.